Know your trade area before you commit to it.
MarketGround shows you who lives, works and shops around any spot on the map. Drop a pin and pick a drive time, or trace the area by hand. The people inside it, their incomes, their homes and the businesses already serving them are on screen before you have finished the thought.
Texas is live today. The rest of the United States is loading now.
Why people use it
Every site decision comes down to three questions.
How many people can actually get here?
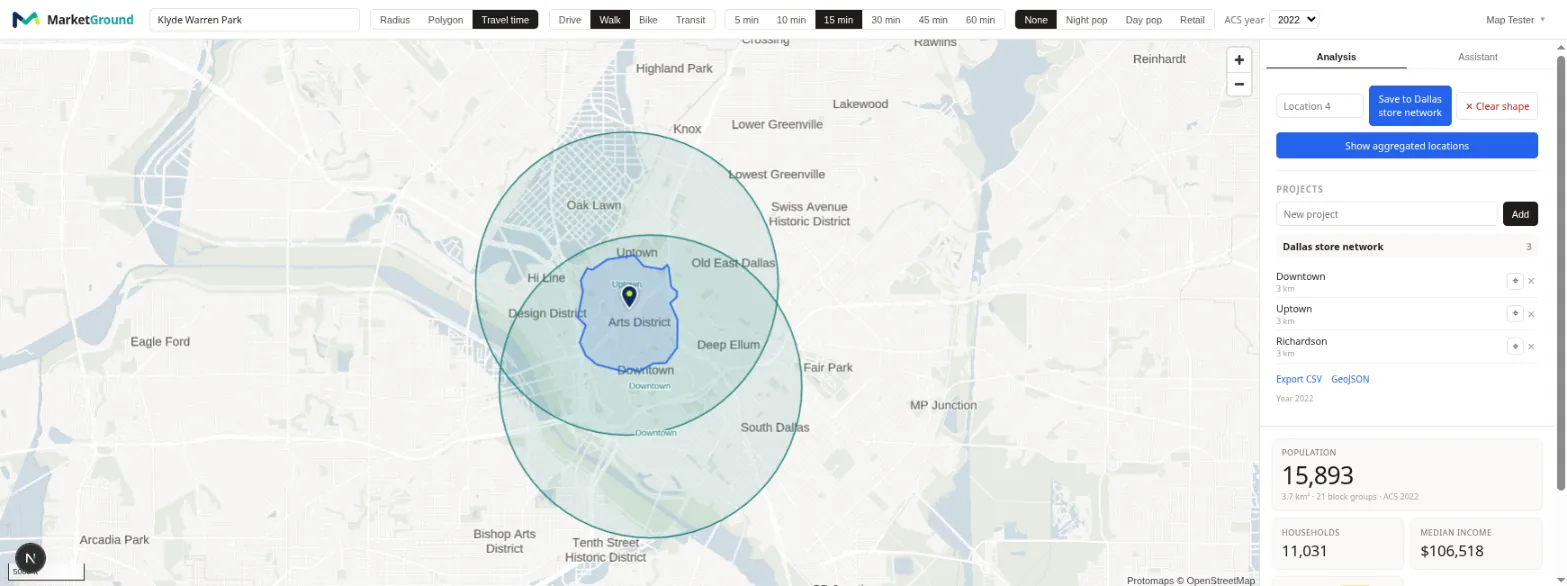
Not how many live inside a circle on a map. How many are within ten minutes by car, or fifteen on foot, or half an hour on the bus. MarketGround follows the real road and transit network, so the shape is the catchment, not a guess at it.
Who are they?
Income, age, household size, renters and owners, education, how they get to work. Seventy-six variables from the Census Bureau, rebuilt for the exact shape you drew rather than the nearest zip code.
What is already there?
The restaurants, clinics, salons and chains inside the area, counted by type and by brand, from the same open data that powers the world's maps. Competition and co-tenancy in one table.
Day and night
The city at noon is not the city at midnight.
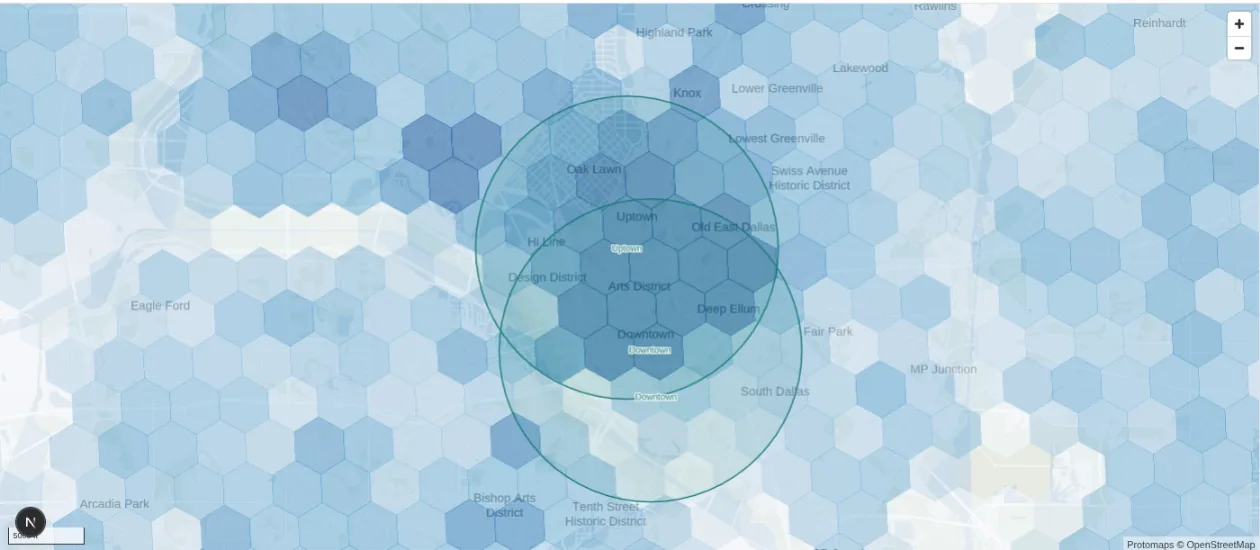
This is central Dallas with the daytime population layer switched on. The darkest hexagons over downtown and the Arts District hold several times their overnight population once the workday starts. Most demographic tools only know the overnight number. MarketGround carries both, for every area you draw, going back to 2016.
If your customers show up at lunch, you should be sizing the lunch crowd.
Projects
Save locations. Compare them. Add them up honestly.
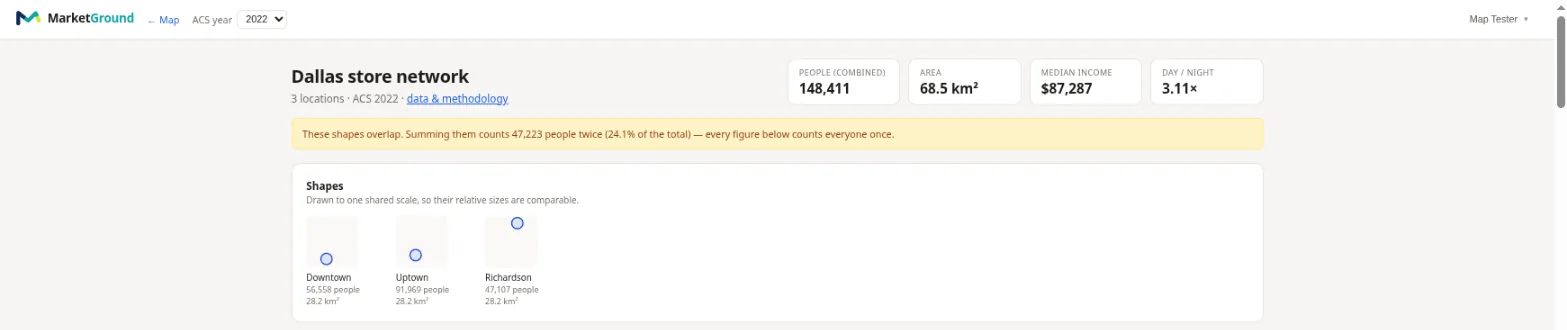
Every area you save goes into a project, and every project gets a report: the combined picture at the top, then each location against the others. When two of your areas overlap, the combined figures count each person once and the page tells you exactly how many were shared. No double counting, no surprises in the pitch meeting.
See the full report on the features pageBuilt on public data
Numbers you can defend in the room.
The foundation is the 2020 Census at block level, the finest population count that exists for the United States. Demographics come from the American Community Survey, annual totals are anchored to the Census Bureau's own county estimates, and businesses come from Overture Maps and Foursquare's open data. Nothing is scraped, licensed from a broker, or made up.
Every load is checked before it is served. The Texas blocks sum to exactly the published state population, 29,145,505. Reconstructed median incomes fall within the Census Bureau's own margin of error for 99.2 percent of block groups. When a figure is approximate, the interface says so right next to it.
Read exactly how the numbers are built- 0.12 km² hexagons under every area, about 340 m across
- Back to 2016 population history, night and day
- 76 demographic variables, medians rebuilt from their brackets
- 1.4 million open businesses and places in Texas, refreshed monthly
Plans
Start free. Grow into it.
Free
Try the analysis on a real location.
- 1 project with up to 4 saved areas
- Radius and hand-drawn polygon areas
- Population, households, income, age and housing
- Day and night population
Pro
For an analyst or a small team evaluating sites regularly.
- 25 projects, 200 saved areas, 3 seats
- Travel-time areas by car, foot, bike and transit, up to 60 minutes
- Every variable: education, employment, commuting, tenure and more
- Population history back to 2016
Team
For organisations running many locations and many people.
- Unlimited projects, saved areas and seats
- Travel-time areas with no duration cap
- Deep analysis mode for the assistant
- 2,000 assistant questions a month
Every limit, side by side, on the pricing page.
Your next location is a few clicks away.
Create a free account, drop a pin on a place you already know, and see whether the numbers match what you have felt on the ground.
Create a free account